Cumulative Layout Shift has been one of the more frustrating Core Web Vitals metrics to diagnose in practice. Tools like PageSpeed Insights give you a score, but they don’t always make it easy to understand exactly which elements are causing the problem or what’s driving the shift. After spending years helping clients identify and fix CLS issues as part of technical SEO audits, I built a free tool to make that diagnosis faster and more actionable: CumulativeLayoutShift.com.
Here’s what it does, why I built it, and why it may be the most efficient starting point when you’re troubleshooting a layout shift problem.
What the Tool Does
CumulativeLayoutShift.com is a free online CLS checker. You enter any URL, choose whether you want to test desktop, mobile, or both, and the tool runs a full PageSpeed Insights analysis and returns the results in a format that’s more diagnostic than what PSI shows by default.
The results include four things that I’ve found most useful in practice:
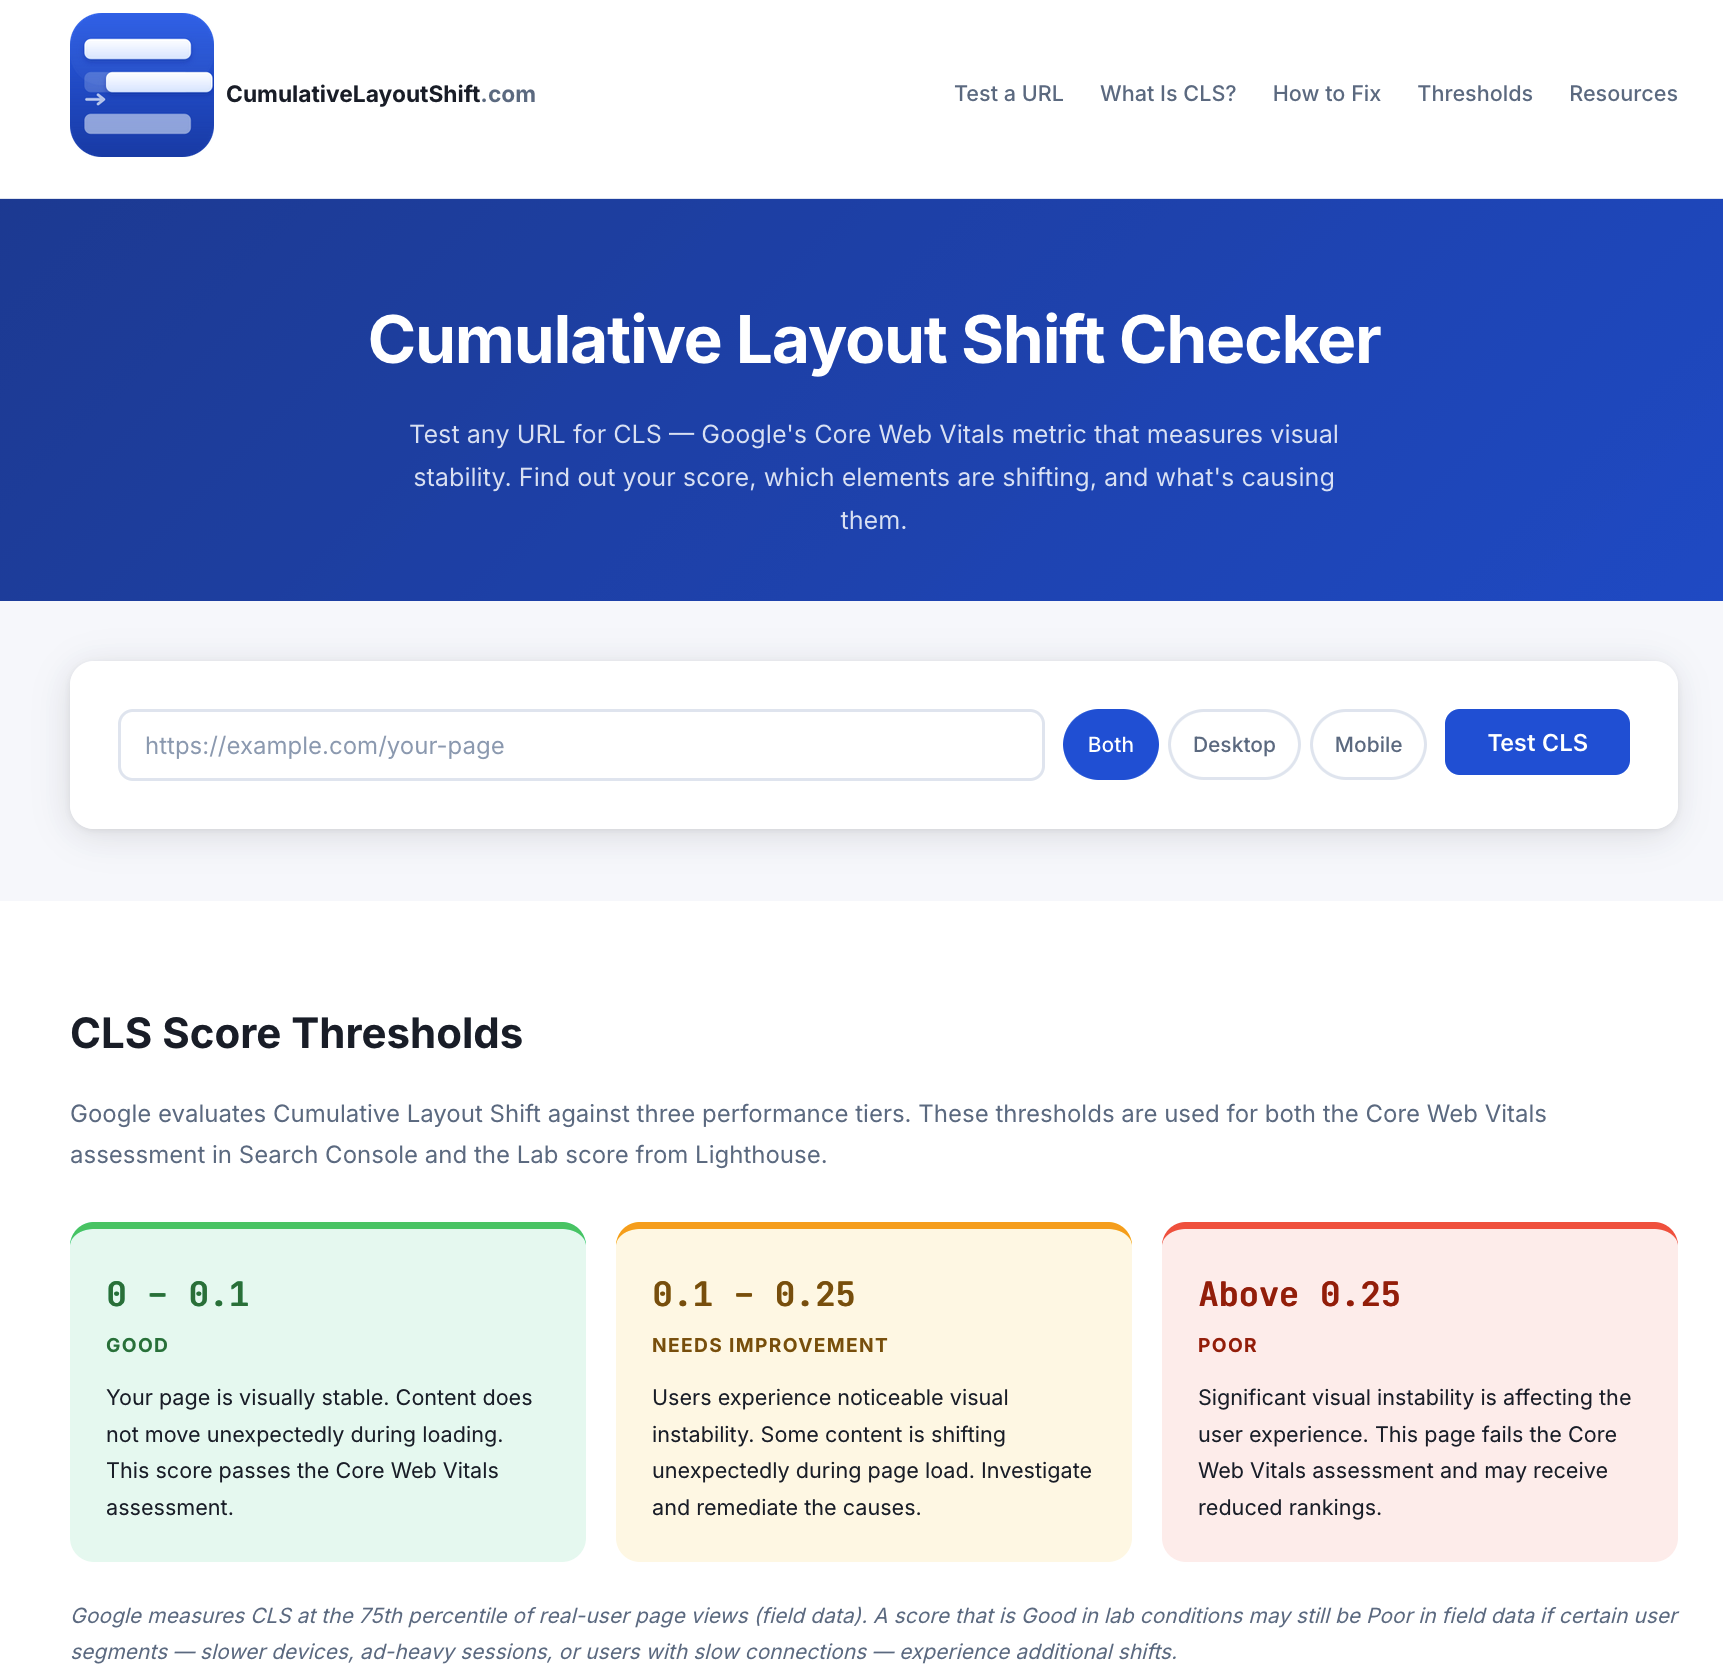
- The lab CLS score and rating. You get the raw CLS score — a dimensionless number between 0 and above 1 in severe cases — and a clear Good / Needs Improvement / Poor rating based on Google’s official thresholds: 0.1 or below is Good, 0.1 to 0.25 Needs Improvement, and above 0.25 is Poor. This is the same scale Google uses for the Core Web Vitals assessment.
- Field data from real users. When Chrome User Experience Report (CrUX) data is available for the URL, the tool displays the real-user field data alongside the lab score. This is critical context. A page that scores 0.04 in lab conditions may score 0.32 in field data if dynamic ad content, personalization modules, or third-party scripts are injecting content that the lab simulation never sees. The lab score tells you what’s happening in controlled conditions; the field score tells you what your actual visitors are experiencing — and it’s the field score that Google uses for the Core Web Vitals assessment in Search Console.
- An element-level breakdown of what shifted. This is the part that saves the most time. When PageSpeed Insights returns element-level data, the tool surfaces each shifting element with its individual shift score, which helps you understand whether you’re dealing with one large shift or several smaller ones that are accumulating.
- Cause-inference badges. For each identified shifting element, the tool attempts to automatically diagnose *why* it shifted. The cause-inference engine evaluates the source element selectors and applies a set of rules to identify common shift causes — images without declared dimensions, elements injected by advertising code, web font load events, third-party widgets, sliders, and similar patterns. Rather than leaving you with a list of CSS selectors and a score, you get a starting point for the actual fix.
Why I Built It
The impetus was straightforward. In technical SEO engagements, CLS diagnosis is a recurring bottleneck. PageSpeed Insights is the go-to starting point, but its interface isn’t optimized for the diagnostic workflow — it presents a score and a list of elements, but doesn’t help you identify the root cause efficiently. Chrome DevTools gives you more granular data but requires a hands-on recording session and a working knowledge of the Performance panel. Neither tool surfaces field data and element-level lab data in the same view with cause context.
Over time I developed a mental checklist for working through CLS problems: check whether images have dimension attributes, check whether ad slots have reserved minimum heights, check whether any font loading is causing text reflow, check whether any late-loading elements are being injected above existing content. That checklist is now embedded in the cause-inference logic of the tool, so it runs automatically on every element the PageSpeed Insights API returns.
I also wanted a tool that correctly handled the gap between lab data and field data. One of the most common misunderstandings I encounter with clients is the assumption that a good lab score means the page passes the Core Web Vitals assessment. It does not. The Core Web Vitals assessment is based entirely on field data — the 75th percentile of real-user Chrome sessions over the preceding 28 days. A page can have excellent lab CLS and still fail in Search Console because the shifts that matter are happening in production, driven by ad content, A/B testing, or authenticated user experiences that the lab simulation never encounters. The tool makes that distinction clear every time results are displayed.
Who Should Use It
Any SEO, developer, or site owner who is working on Core Web Vitals improvement will find this tool useful as a first step. I would particularly recommend it for:
Technical SEO audits. When auditing a site’s Core Web Vitals, I use this tool to quickly assess multiple URLs — the homepage, key landing pages, product pages, and article templates — to identify which page types have the worst CLS and which elements are responsible. The cause-inference output makes it easier to triage: an image dimension problem across 200 product pages is a template fix, while an ad slot problem may require configuration changes in the ad management platform.
Before and after verification. After implementing a CLS fix, the tool provides a quick way to confirm that the fix worked in lab conditions before waiting four weeks for Search Console field data to catch up. If a fix resolves the shift at the element level in lab conditions, that’s a strong indicator the field data will improve as the 28-day window rolls forward.
Diagnosing discrepancies between lab and field scores. If you’re seeing a good lab score but a poor field score in Search Console, this tool surfaces the field data alongside the lab results so you can see the gap in one place, then use that as a starting point for investigating what production conditions are producing the additional shifts.
WordPress and Shopify sites. The site also includes detailed platform-specific guides for WordPress and Shopify — two platforms where CLS issues are especially common because of how themes, page builders, and app ecosystems layer dynamic content on top of each other. I’ve written those guides to address the specific causes I encounter most frequently on each platform.
How to Get Started
Go to https://www.cumulativelayoutshift.com, enter the URL of the page you want to test, and select your device target. The analysis typically completes in 10 to 30 seconds, depending on the complexity of the page and PageSpeed Insights API response times.
If your page has a CLS score above 0.1, start with the element list. The cause-inference badges will point you toward the most likely root cause. From there, the How to Fix CLS guide on the same site walks through remediation techniques for each cause category, with specific code examples.
The tool is free, requires no account, and does not store the URLs you submit. It is operated through Hartzer Consulting as a resource for site owners and technical SEO professionals who need a faster path from CLS score to actionable fix.
If you have a page that is producing an unexpectedly high CLS score — or if your lab and field scores are diverging in a way you can’t explain — I’d encourage you to run it through the checker and see what the element breakdown shows. In most cases, the path to a fix becomes clearer once you know exactly what shifted and why.