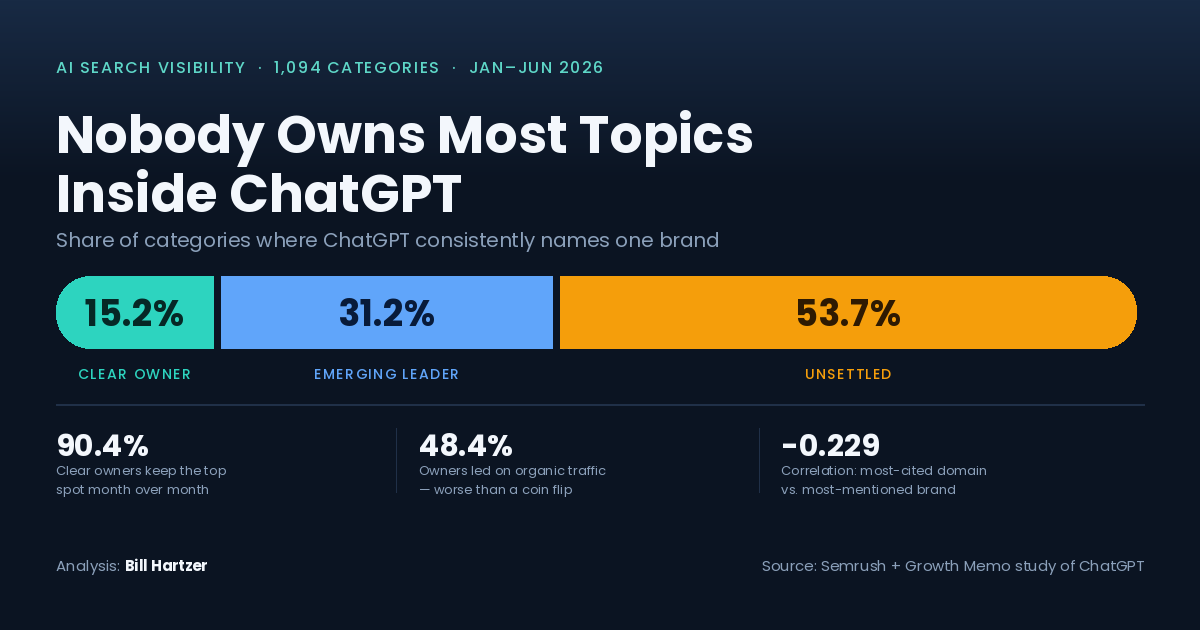
Executive teams have been asking a version of the same question for two years now. When a customer asks ChatGPT which vendor to buy from, does our name come up? Until recently the honest answer was that nobody had measured it at scale.
Semrush has now done so. Working with Kevin Indig of Growth Memo, the company tracked 1,094 US product and service categories from January through June 2026, spanning 220,000-plus domains, some 50,000 brands and roughly 600,000 citations. The published findings are worth reading in full, and the full Semrush study on ChatGPT topic authority includes the underlying charts.
My interest here is narrower than the research itself. Three of the findings carry direct consequences for how a company allocates budget, staffs the work, and reports progress to a board. Those consequences are the subject of this article.
What The Research Measured
Semrush defined a category as a cluster of five prompts mirroring the sequence a buyer moves through: the definition question, the comparison question, the alternatives question, the use case question, and the purchase question. Payroll software is a category. Small business banking is a category. So is best pillows for neck pain.
For each prompt the researchers recorded which brands ChatGPT named in the answer itself, along with the sources the assistant linked. A brand qualified as the category owner if it held the largest mention share, surfaced in a minimum of four prompts, and led the second-place brand by five percentage points or more. Anything short of that threshold was classified as an emerging leader or, where no brand reached three prompts, as unsettled.
Two details in that design matter for interpretation. The study counted mentions in the answer text rather than citations in the source list, on the strength of prior research showing that 74% of users chose the top-mentioned brand. And the data set covers ChatGPT in the United States, which means it describes one assistant in one market over a six-month window.
Three Findings With Budget Consequences
More Than Half Of All Categories Remain Unclaimed
Across the 1,094 categories, 15.2% had a clear owner, 31.2% had an emerging leader, and 53.7% were unsettled. The distribution then inverts in a way that should shape category selection. Only 11.3% of the top half of topics by AI search volume had a clear owner, and that top half carries 98% of the AI search volume measured. The low-volume tail came in at 19%.
The categories carrying the most commercial value are the categories with the least established leadership. That is an argument for concentration rather than coverage. A budget spread thinly across twenty categories buys a one-point lead in each, and a one-point lead, as the stability data below shows, is worth very little.
Site-Level SEO Metrics Do Not Predict Topic Ownership
Semrush compared category owners against their runners-up on three familiar measurements. Owners held higher branded search volume in 55.7% of pairs, a higher Authority Score in 52.5%, and higher organic traffic in 48.4%. Each result sits close enough to chance that none of the three functions as a reliable predictor.
Indig characterized the obvious reading of that result as a hypothesis rather than a finding, and the caution is warranted. My own read is that the comparison mixes two different levels of measurement. Branded search volume, Authority Score and organic traffic describe the performance of an entire domain. Category ownership describes performance inside one narrow cluster of buyer questions. A company can hold excellent domain-level numbers and still have almost nothing published against the comparison and alternatives questions in the one category its revenue depends on. Sitewide averages conceal that gap by design.
The practical consequence for a marketing leader is that existing SEO (Search Engine Optimization) reporting will not tell you where you stand in AI search. It was never built to answer a topic-level question.
Leadership Is Sticky Once The Margin Is Wide Enough
Clear category owners retained first position in 90.4% of month-over-month comparisons. Categories without a settled owner behaved very differently, with leadership turning over in 1,950 of 5,470 comparisons. Margin explains the difference. Categories where the leader flipped carried a median lead of 1.3 percentage points, and categories where the leader held carried 2.9.
That gives an operator something usable. A lead of one or two percentage points is measurement noise. A lead approaching three points begins to persist. A lead of five points, on this data, holds nine times out of ten. The same finding cuts both ways: if a competitor establishes a five-point lead in your core category, the observed retention rate is working against you every month you wait.
The Reporting Problem Most Companies Have Right Now
One statistic in the study deserves more attention than it has received. The most-cited domain in a category matched the most-mentioned brand just 21% of the time, and the correlation between those two measures is slightly negative at -0.229.
The assistant recommends one party in the sentence and links a different party underneath it. The linked sources are review platforms, community threads, trade publications and comparison articles. The recommended brand is usually not the publisher of the page being cited.
Ask your agency or in-house team which of the two they are reporting. A dashboard that counts how often your own domain appears in ChatGPT’s source list is measuring a publisher outcome. A dashboard that counts how often your brand is named in the answer is measuring a buying outcome. The two move independently, and only one of them corresponds to a customer decision.
Why The Budget May Sit In The Wrong Department
If mention share is the outcome that matters, and the sources feeding it are third-party properties, then a meaningful share of the work falls outside the search team’s remit.
Review site presence belongs to product marketing or customer marketing. Trade publication coverage belongs to communications. Community reputation belongs to whoever owns the customer relationship. Entity consistency across schema, brand naming and third-party profiles belongs to the technical SEO function. Content covering the full buyer question sequence belongs to content strategy. Assigning the entire program to one team and asking for AI visibility as the deliverable sets that team up to fail, because it controls perhaps a third of the inputs.
Companies that treat this as a cross-functional program will build category positions faster than companies that treat it as an SEO line item. That is a budget and governance decision, not a tactical one.
How I Would Approach This In An Engagement
The sequence I use with clients follows the logic of the research itself.
Baseline first. Establish current mention share for the categories that actually carry revenue, measured across the full five-question buyer sequence rather than a handful of favored prompts. The output is a margin, expressed in percentage points against the nearest competitor.
Select second. Choose two or three categories where the company already holds content depth, a defensible product claim, and a realistic path to a three-point margin. Categories where a competitor already sits above five points are a different kind of project and should be scoped as such.
Close the coverage gap third. Most companies have a strong definition page and very little addressing comparison, alternatives and fit. Those are the prompts where buyers decide.
Correct entity signals fourth. Brand naming that stays identical across every property, organization schema carrying accurate sameAs references, and third-party profiles that do not contradict one another. Assistants resolve an entity before they recommend it.
Earn source position fifth. Identify the specific domains cited in your categories and pursue accurate representation on them. This is reputation work, and it runs on relationships and merit rather than on publishing volume.
Then track margin monthly. Not rank. Not citation count. The point spread between your brand and the runner-up, watched against the 1.3 and 2.9 point thresholds the study established.
What I Would Caution Against
Buying a visibility tool is not a strategy. The tool reports the score; the score does not move itself.
Treating correlation as causation is the failure mode this particular study invites, and Indig said as much in the publication itself. The research identifies what accompanies category ownership. It does not establish what produces it.
Extrapolating beyond the data set is the third risk. Six months, one assistant, one country. Gemini, Perplexity, Copilot and Google AI Overviews were not measured, and there is no basis in this data for assuming they behave the same way.
What the study does establish is that the topic, rather than the keyword or the page, is now the unit of competition, and that most topics have no incumbent. Companies that select carefully and commit budget across the right functions have a measurable window. Companies that wait for the picture to clarify will be buying position from an incumbent that retains it nine months out of ten.